
Shorting The VIX
An effective, reliable way to trade Volatility with limited risk
February 20th 2020 (Updated February 22nd 2020)
The volatility index (VIX) was designed to measure the volatility in options of the S&P 500 for financial instruments including SPX, SPXW, SPY. Volatility is a great way to measure the direction of the market. Higher volatility implies a good time to short the SPX. Lower volatility implies a good time to go long on the SPX. While our analysis of VIX does not go too much into detail of how it functions. We still highly suggest you review the whitepaper1 about the VIX to learn how the product is measured and traded.
The strategy we are going to review uses primarily Bollinger Bands2. Bollinger Bands are a measure of normal distribution based on the standard deviations of closing prices. Candlesticks for stocks generally stay within these bollinger bands, especially indices that have higher volume and many more market participants. The closer a candle goes to the lower or higher Bollinger Band. The lower the probability that the market will continue going lower or higher. Our observation actually showcases how to trade the VIX with almost an 80% win rate by trading lower risk delta neutral credit spreads. We will also be going over higher risk, higher reward trades that should be traded based on different conditions.
Keep in mind that there are several conditions that must be met in order to consistently win 8 out of 10 trades. The profit potential for 8 of 10 wins will sometimes be between 10-20%. So in hindsight, the risk:reward ratio is not as great as it seems at first glance. However, We will also be going through the probabilities of much higher risk trades as well, typically these higher risk trades have a far higher risk:reward ratio of upwards to 500-1000%, which means it's a good idea to use less margin and leverage on those types of trades given the lower probability of success. Furthermore, a solid understanding of how options work. How to trade option spreads. As well as how volatility of options pricing works are important before taking action on any of the suggestions made in this article.
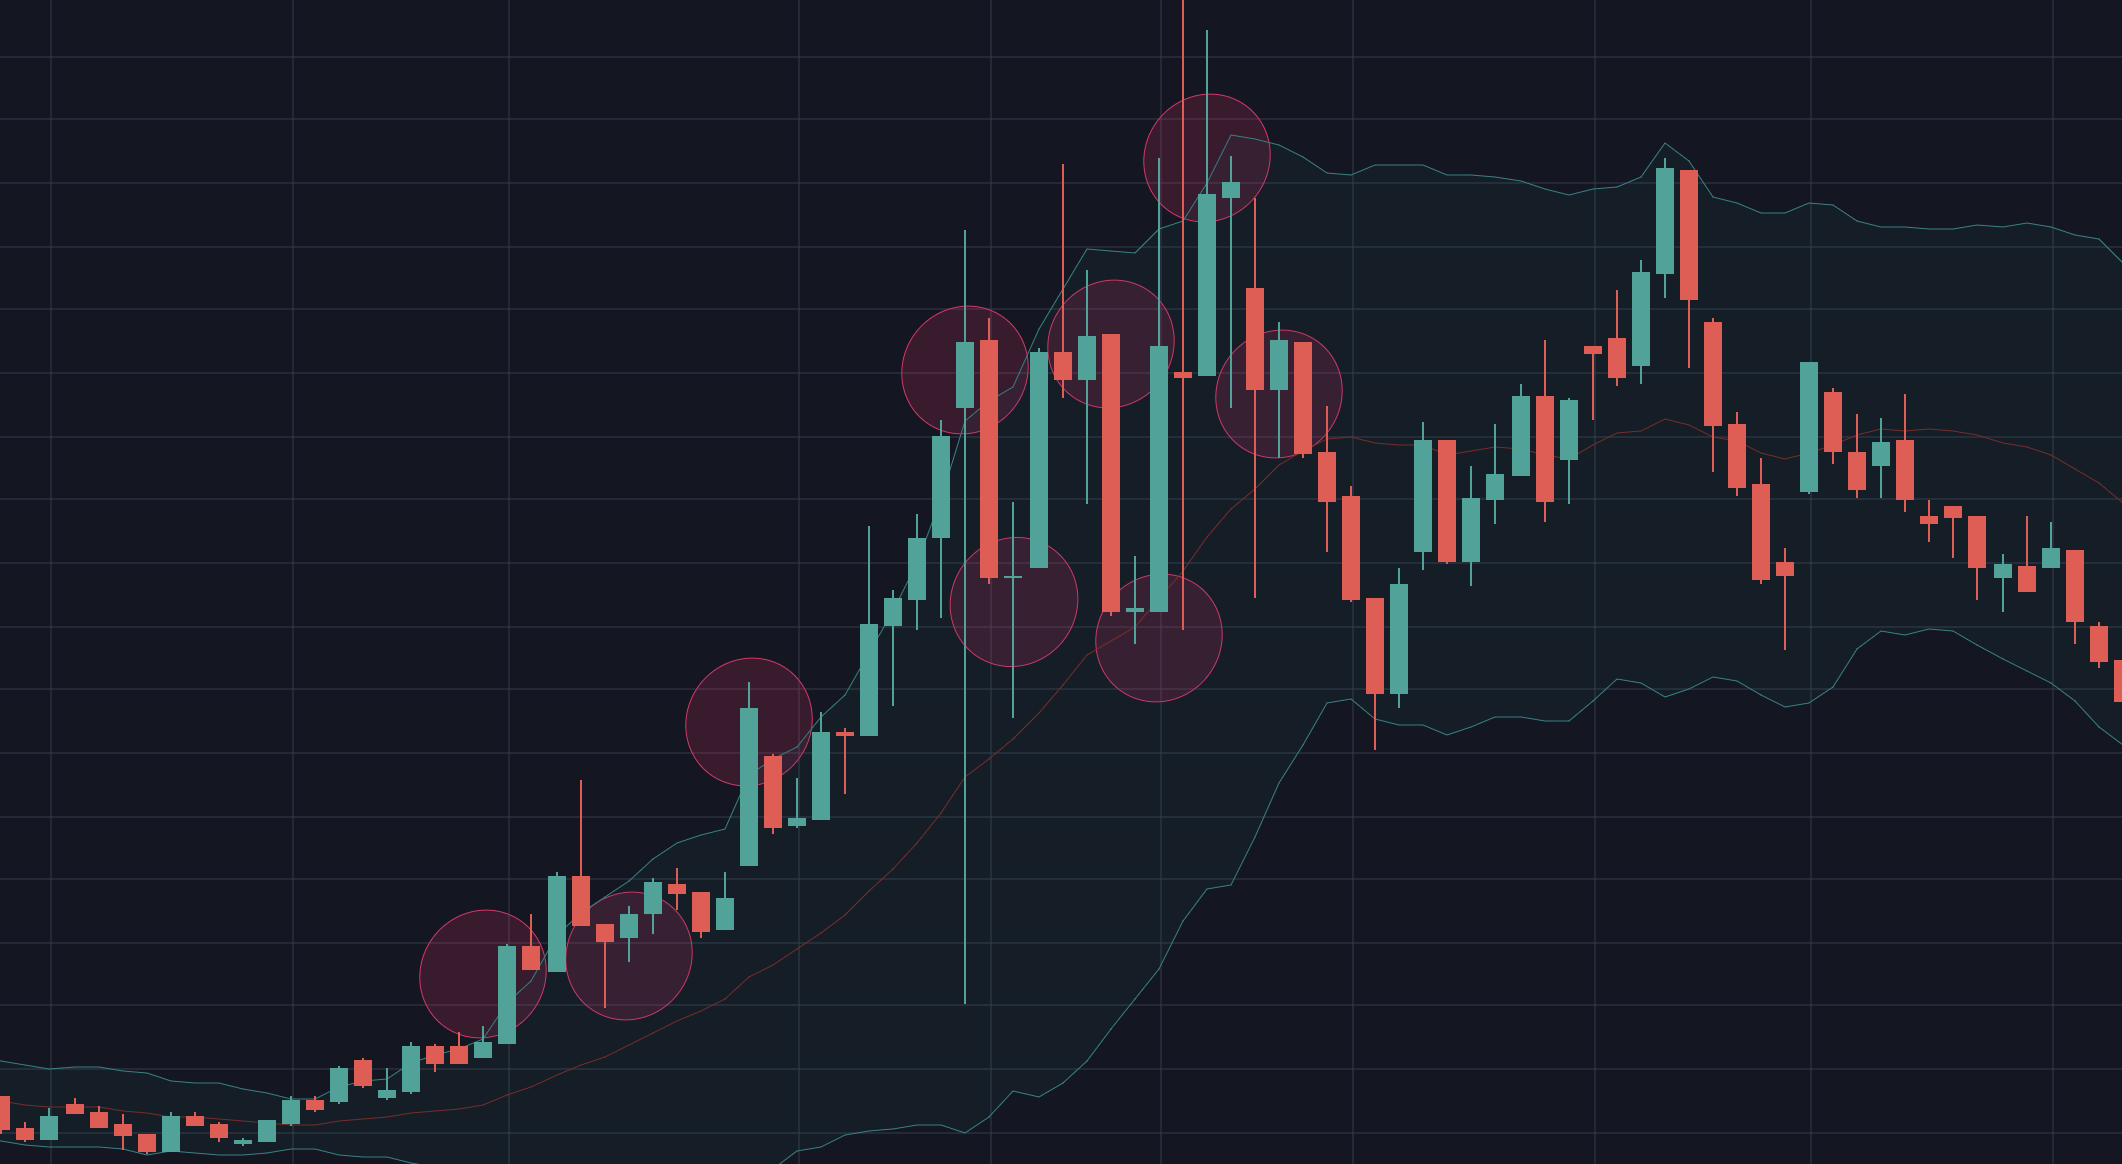
First, let's observe historical price action of the VIX with daily candles. The images are intended to illustrate several key things. The first image is from August 2019 to December 2019. Historically, when VIX exits the upper channel of the Bollinger Band. It almost always retraces and is down the next day. The second observation, is that a few days after it reenters the Bollinger Band. It has a small spike upwards before trading downward a significant amount the next few weeks.
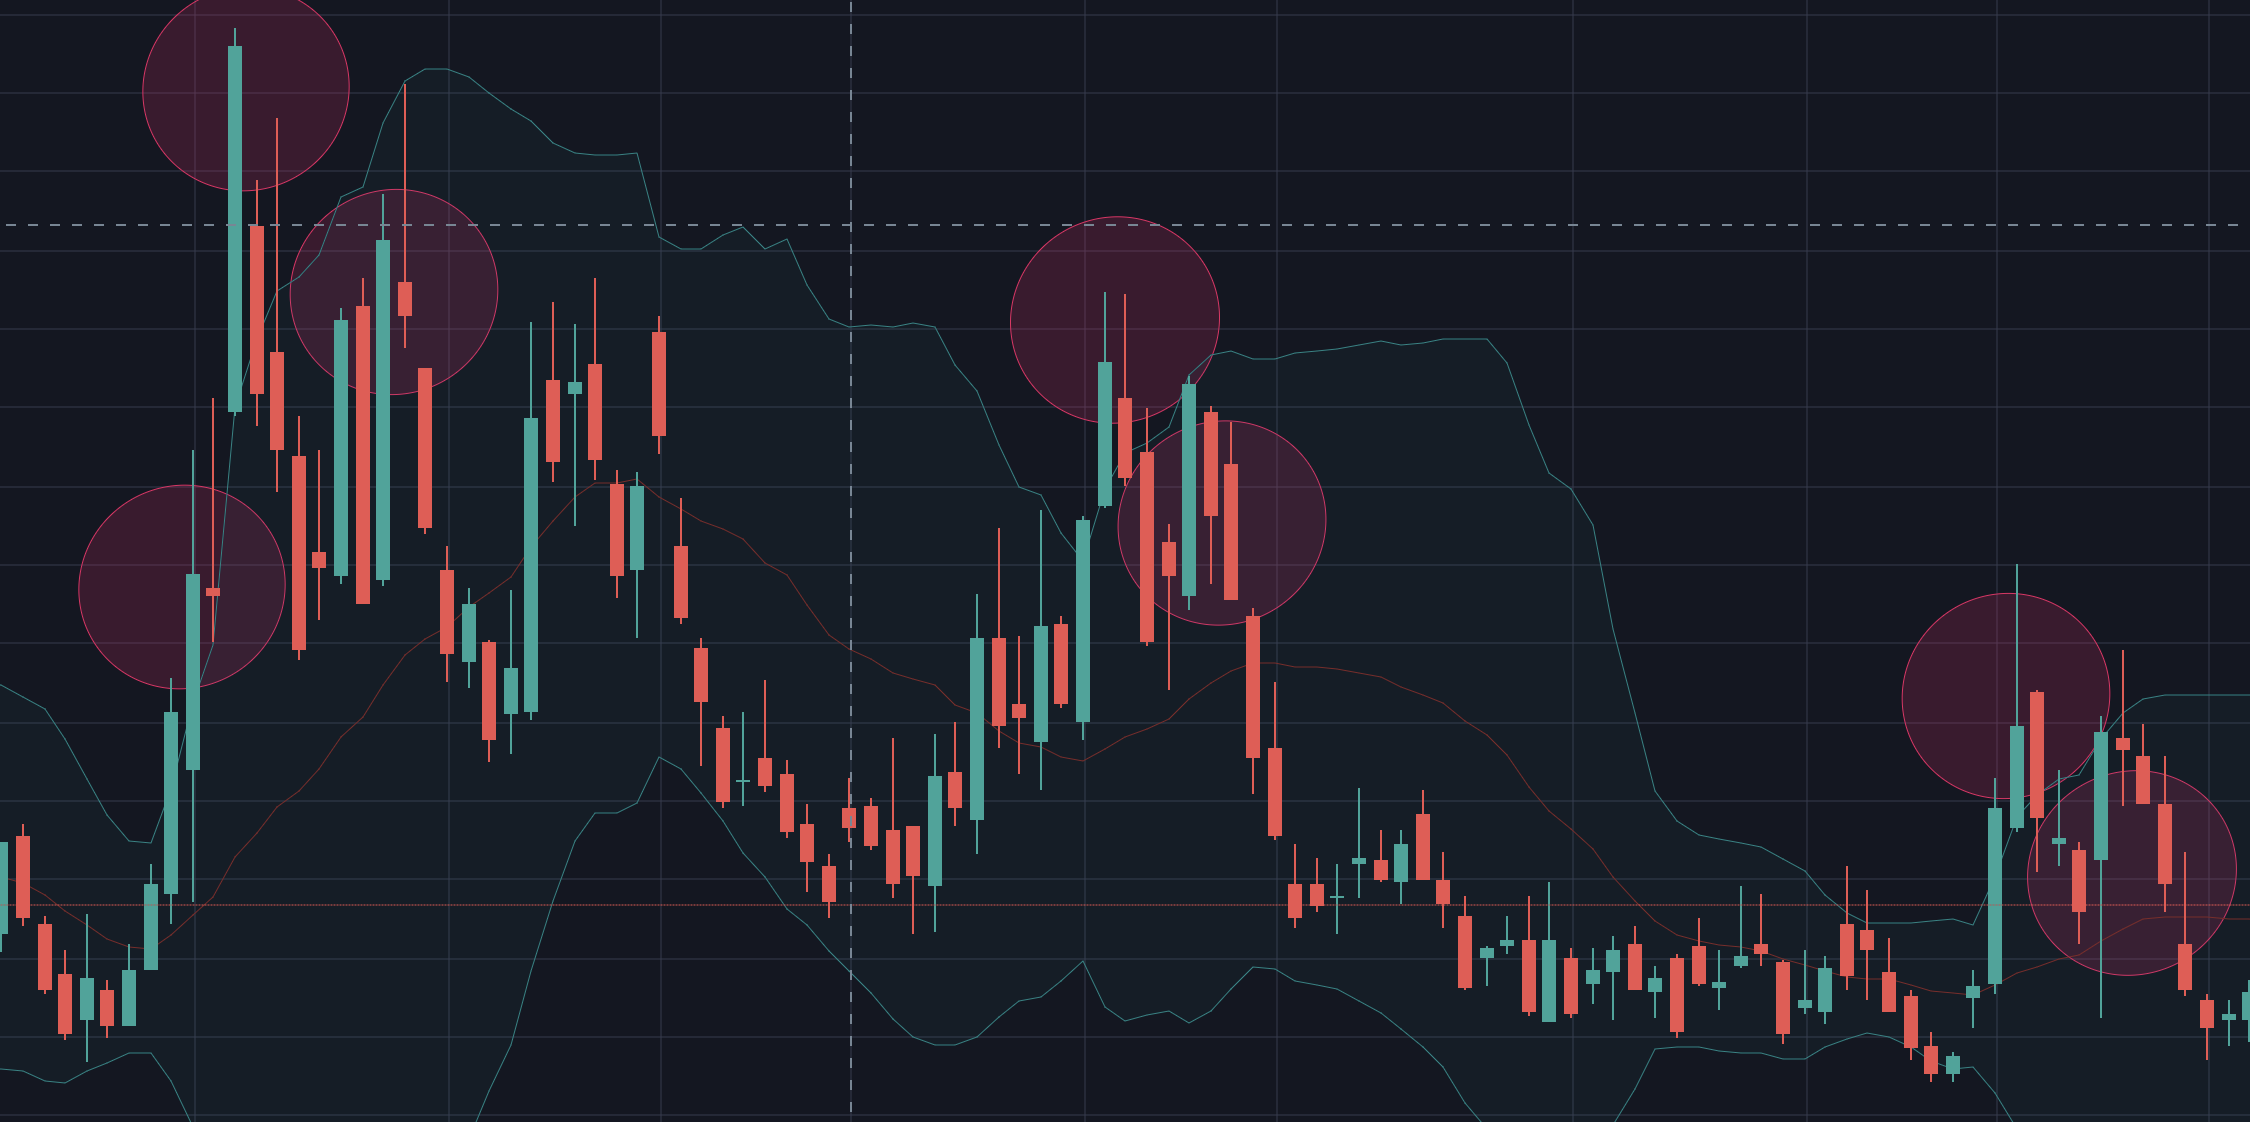
Keep in mind that sometimes it will exit the upper channel and still trade upwards. For example when it countered that trend on August 1st 2019. There were several Tarriffs implemented on Chinese products. When it countered the trend there was a pretty obvious and rational reason why it continued to spike. Thus with good intuition, you can cut your VIX short early if any news driven Volatility events occur.
A more interesting aspect of this pattern is observing the 2008 Great Financial Crisis. Surprisingly, this pattern still exists even with VIX going to levels of 90. The key problem when trying to trade in these conditions is how time sensitive the trade is. It still is possible to effectively time and trade these movements. However, a very solid understanding of how delta and gamma of open interest impact market movements is crucial. This is something that even the top hedge funds have difficulty effectively wrangling and predicting. We generally suggest avoiding these conditions when trying to trade this pattern.
Furthermore, if VIX goes above 30, or if you want to be really safe, 20. We don't suggest trading this pattern as the timing is extremely sensitive and it's more important to focus on how delta is being hedged for SPY, SPX and SPXW to determine price action since the timing of VIX would be far too sensitive to use this pattern specifically.
Why does this pattern exist?
What makes this pattern so fascinating is that it's entirely driven by people buying too many puts. When too many people are short SPX, NDX and DJI. The market makers have no choice but to keep the market up. This pattern breaks when there is sell pressure that is more powerful than the market makers. This generally doesn't happen unless there are extreme cases such as the 2008 Financial Crisis. The key thing to remember is that, whenever possible, the market maker is always delta neutral. Which means that the market maker will always try to move SPY and SPX in the direction where there is the least Open Interest for in the money options. In another article, we will be discussing crucial points on why understanding Delta and Gamma of Open Interest on Options is important to predicting and trading any stock.
Probability on Paper
The following calculations showcase that this pattern is successful a whopping 75% of the time. This is including data from 2000-2020. Which means we are factoring in both the dot com bubble and Great Financial Crisis. More disciplined traders can win with this strategy over 90% of the time if they factor in bigger implied volatility spikes like the ones mentioned. For example, the 2020 Corona Virus supply chain shock will most likely break this pattern and will bring VIX closer to a level of 30.
Below showcases successful (and unsuccessful) periods that this pattern worked. The pattern is considered successful if the VIX trades at a lower level 30 days after the pattern appears.
| Date | Price | Band value | Price in 30 days | Successful |
| 2003-06-09 | 22.15 | 22.0151 | 19.17 | Yes |
| 2003-08-01 | 20.75 | 20.6182 | 19.28 | Yes |
| 2003-09-10 | 20.01 | 19.8703 | 17.67 | Yes |
| 2003-09-24 | 21.22 | 20.5702 | 16.86 | Yes |
| 2003-11-17 | 18.6 | 18.3389 | 18.31 | Yes |
| 2003-12-31 | 18.31 | 18.2014 | 15.58 | Yes |
| 2004-03-10 | 18.67 | 17.4155 | 14.61 | Yes |
| 2004-05-07 | 18.13 | 18.0022 | 14.31 | Yes |
| 2004-07-26 | 17.3 | 17.1913 | 14.07 | Yes |
| 2004-08-05 | 18.32 | 17.8089 | 14.03 | Yes |
| 2004-10-14 | 16.43 | 15.9976 | 12.78 | Yes |
| 2004-10-25 | 16.58 | 16.5757 | 13.67 | Yes |
| 2005-01-03 | 14.08 | 13.9663 | 11.27 | Yes |
| 2005-03-03 | 12.93 | 12.9153 | 17.74 | No |
| 2005-03-22 | 14.27 | 14.0151 | 13.85 | Yes |
| 2005-04-15 | 17.74 | 16.1562 | 12.15 | Yes |
| 2005-08-04 | 12.52 | 12.2980 | 11.22 | Yes |
| 2005-10-05 | 14.55 | 14.1218 | 12.26 | Yes |
| 2006-01-18 | 12.25 | 12.2242 | 11.72 | Yes |
| 2006-04-07 | 12.26 | 12.1939 | 17.72 | No |
| 2006-05-12 | 14.19 | 13.1974 | 15.62 | No |
| 2006-05-22 | 17.72 | 17.2930 | 14.15 | Yes |
| 2006-06-12 | 20.96 | 20.4662 | 14.85 | Yes |
| 2006-11-27 | 12.3 | 11.9907 | 10.87 | Yes |
| 2006-12-07 | 12.67 | 12.3883 | 9.89 | Yes |
| 2007-02-12 | 11.61 | 11.5674 | 13.48 | No |
| 2007-02-27 | 18.31 | 14.3897 | 13.49 | Yes |
| 2007-06-06 | 14.87 | 14.4401 | 15.23 | No |
| 2007-06-26 | 18.89 | 17.8454 | 21.45 | No |
| 2007-07-24 | 18.55 | 18.3405 | 24.58 | No |
| 2007-08-10 | 28.3 | 28.2738 | 19.37 | Yes |
| 2007-10-19 | 22.96 | 21.1992 | 23.61 | No |
| 2007-11-07 | 26.49 | 25.2363 | 20.58 | Yes |
| 2008-01-17 | 28.46 | 27.3541 | 26.28 | Yes |
| 2008-03-10 | 29.38 | 28.9656 | 20.87 | Yes |
| 2008-06-06 | 23.56 | 21.9532 | 23.05 | Yes |
| 2008-07-02 | 25.92 | 25.7071 | 20.34 | Yes |
| 2008-07-11 | 27.49 | 27.1138 | 18.81 | Yes |
| 2008-09-04 | 24.03 | 22.9036 | 67.61 | No |
| 2009-08-17 | 27.89 | 27.0834 | 25.19 | Yes |
| 2009-09-01 | 29.15 | 27.8315 | 22.86 | Yes |
| 2009-10-01 | 28.27 | 27.2528 | 24.24 | Yes |
| 2009-11-02 | 29.78 | 29.4009 | 21.49 | Yes |
| 2010-01-21 | 22.27 | 21.7239 | 17.42 | Yes |
| 2010-04-27 | 22.81 | 20.0062 | 33.73 | No |
| 2010-05-05 | 24.91 | 24.2277 | 25.05 | No |
| 2010-11-16 | 22.58 | 22.4042 | 17.52 | Yes |
| 2010-11-30 | 23.54 | 23.3091 | 16.24 | Yes |
| 2011-01-28 | 20.04 | 19.1879 | 21.13 | No |
| 2011-02-22 | 20.8 | 19.8628 | 17.25 | Yes |
| 2011-03-15 | 24.32 | 23.9143 | 15.35 | Yes |
| 2011-06-15 | 21.32 | 20.5679 | 23.74 | No |
| 2011-07-27 | 22.98 | 22.4340 | 34.32 | No |
| 2012-02-15 | 21.14 | 20.7696 | 15.48 | Yes |
| 2012-04-09 | 18.81 | 17.4222 | 22.01 | No |
| 2012-05-14 | 21.87 | 21.0579 | 19.72 | Yes |
| 2012-06-01 | 26.66 | 26.1733 | 17.11 | Yes |
| 2012-07-24 | 20.47 | 20.4053 | 17.74 | Yes |
| 2012-08-30 | 17.83 | 17.4955 | 16.14 | Yes |
| 2012-10-23 | 18.83 | 17.8391 | 15.9 | Yes |
| 2012-12-20 | 17.67 | 17.6091 | 13.72 | Yes |
| 2013-02-04 | 14.67 | 14.6251 | 14.39 | Yes |
| 2013-02-21 | 15.22 | 15.0257 | 13.92 | Yes |
| 2013-04-15 | 17.27 | 15.6283 | 14.48 | Yes |
| 2013-05-29 | 14.83 | 14.7361 | 14.01 | Yes |
| 2013-06-12 | 18.59 | 18.3483 | 12.97 | Yes |
| 2013-06-20 | 20.49 | 19.3305 | 11.98 | Yes |
| 2013-08-15 | 14.73 | 14.1272 | 15.46 | No |
| 2013-08-27 | 16.77 | 16.4265 | 19.6 | No |
| 2013-10-03 | 17.67 | 17.1499 | 12.37 | Yes |
| 2013-12-02 | 14.23 | 14.0311 | 12.28 | Yes |
| 2013-12-11 | 15.42 | 15.3195 | 17.42 | No |
| 2014-01-24 | 18.14 | 15.7832 | 14.2 | Yes |
| 2014-02-03 | 21.44 | 19.9573 | 14.52 | Yes |
| 2014-03-13 | 16.22 | 15.8451 | 14.06 | Yes |
| 2014-04-11 | 17.03 | 16.5423 | 11.51 | Yes |
| 2014-07-17 | 14.54 | 13.3466 | 12.05 | Yes |
| 2014-07-31 | 16.95 | 15.1570 | 13.31 | Yes |
| 2014-09-15 | 14.12 | 13.7118 | 16.04 | No |
| 2014-09-23 | 14.93 | 14.3460 | 14.89 | Yes |
| 2014-10-01 | 16.71 | 16.6372 | 13.02 | Yes |
| 2014-10-09 | 18.76 | 18.2997 | 13.58 | Yes |
| 2014-12-09 | 15.35 | 14.9438 | 16.66 | No |
| 2015-05-06 | 15.15 | 14.7767 | 13.19 | Yes |
| 2015-06-08 | 15.29 | 15.1565 | 12.22 | Yes |
| 2015-06-29 | 18.85 | 16.8756 | 13.71 | Yes |
| 2015-07-08 | 19.66 | 19.2489 | 15.25 | Yes |
| 2015-08-19 | 15.25 | 15.0883 | 22.55 | No |
| 2015-11-12 | 18.37 | 17.2810 | 16.91 | Yes |
| 2015-12-11 | 24.39 | 21.8668 | 23.11 | Yes |
| 2016-01-07 | 24.99 | 24.4807 | 19.38 | Yes |
| 2016-06-10 | 17.03 | 16.7084 | 12.87 | Yes |
| 2016-06-24 | 25.76 | 24.0381 | 11.5 | Yes |
| 2016-08-24 | 13.45 | 13.3898 | 12.84 | Yes |
| 2016-09-09 | 17.5 | 15.3845 | 13.34 | Yes |
| 2016-10-13 | 16.69 | 16.6422 | 12.34 | Yes |
| 2016-11-01 | 18.56 | 18.0439 | 13.19 | Yes |
| 2016-12-30 | 14.04 | 14.0360 | 10.74 | Yes |
| 2017-02-28 | 12.92 | 12.5672 | 15.07 | No |
| 2017-04-10 | 14.05 | 13.7210 | 10.72 | Yes |
| 2017-05-17 | 15.59 | 14.2883 | 11.44 | Yes |
| 2017-06-29 | 11.44 | 11.4340 | 15.51 | No |
| 2017-08-08 | 10.96 | 10.7432 | 9.78 | Yes |
| 2017-08-17 | 15.55 | 15.3253 | 9.51 | Yes |
| 2017-10-23 | 11.07 | 10.6889 | 11.33 | No |
| 2017-11-15 | 13.13 | 12.4230 | 11.04 | Yes |
| 2018-01-16 | 11.66 | 11.1281 | 19.85 | No |
| 2018-01-29 | 13.84 | 13.1127 | 16.35 | No |
| 2018-03-22 | 23.34 | 22.2432 | 14.77 | Yes |
| 2018-05-29 | 17.02 | 16.5489 | 13.63 | Yes |
| 2018-06-25 | 17.33 | 16.6182 | 10.93 | Yes |
| 2018-08-13 | 14.78 | 14.4015 | 12.42 | Yes |
| 2018-10-05 | 14.82 | 14.4863 | 18.14 | No |
| 2018-12-17 | 24.52 | 24.4630 | 16.57 | Yes |
| 2019-05-01 | 14.8 | 14.4167 | 15.82 | No |
| 2019-05-09 | 19.1 | 18.7608 | 15.4 | Yes |
| 2019-07-31 | 16.12 | 15.1454 | 14.22 | Yes |
| 2019-10-01 | 18.56 | 18.0484 | 12.68 | Yes |
| 2019-12-02 | 14.91 | 14.0256 | 12.42 | Yes |
| 2020-01-27 | 18.23 | 16.0953 | No |
Profit Potential on Paper
We will be creating example options data using Black Scholes3 to create example credit and debit spreads to showcase potential profit. We will also be showcasing example SPY option spreads. The example spreads shown have the potential to profit over 500-1000% if you are directionally correct. Please keep in mind that these spreads do not factor changes in IV Rank over time and have a fixed IV Rank. Your profit potential may be much, much higher with the correct timing!
On October 2nd the VIX spiked to a closing price of 20.56. First let's observe less aggressive debit and credit spreads on the VIX. The examples we will be going from progressively more risk, to higher reward. All these spreads would be for November 20th and purchased on October 2nd. The example exit prices would be for October 3rd, October 4th and October 15th.
Trading the VIX 22/24 Bear Call Spread
For the example bear call spread. The net credit would be 0.61 cents per spread. Thus, purchasing 10 of that contract spread would be a total of $610 net credit. Keep in mind that the amount of excess margin required for this trade would be $1390 USD. This trade is great if you intend on trading delta neutral, or rather, are hedging specifically on theta instead of delta or vega.
| Entry Date | Expiry | # Contracts | Price | Strike | Delta | Theta | Vega | Gamma |
| October 2nd | November 20th | -10 | 2.12 | 22 | 0.48388 | -0.02758 | 0.03003 | 0.05879 |
| October 2nd | November 20th | +10 | 1.51 | 24 | 0.38046 | -0.02635 | 0.02869 | 0.05618 |
Net Credit
$610
Selling the position the day after
| Entry Date | Expiry | # Contracts | Price | Strike | Delta | Theta | Vega | Gamma |
| October 3nd | November 20th | -10 | 1.46 | 22 | 0.39361 | -0.02498 | 0.02664 | 0.06171 |
| October 3nd | November 20th | +10 | 0.99 | 24 | 0.29580 | -0.02243 | 0.02393 | 0.05542 |
Realized PnL
$140
Selling the position two days after
| Entry Date | Expiry | # Contracts | Price | Strike | Delta | Theta | Vega | Gamma |
| October 4th | November 20th | -10 | 0.75 | 22 | 0.26211 | -0.01902 | 0.01987 | 0.05933 |
| October 4th | November 20th | +10 | 0.47 | 24 | 0.18239 | -0.01545 | 0.01614 | 0.04819 |
Realized PnL
$330
Selling the position October 15th
| Entry Date | Expiry | # Contracts | Price | Strike | Delta | Theta | Vega | Gamma |
| October 15th | November 20th | -10 | 0.08 | 22 | 0.05632 | -0.00601 | 0.00481 | 0.02970 |
| October 15th | November 20th | +10 | 0.04 | 24 | 0.02909 | -0.00352 | 0.00281 | 0.01738 |
Realized PnL
$570
It's clear that this spread provides a great, low risk way to trade volatility based on theta instead of delta or vega.
Trading the VIX 20/18 Bear Put Spread
A similar strategy with limited risk is the 20/18 Bear Put spread. This spread does not actually require any excess margin, but is a debit spread. Purchasing 10 of these requires $940 USD.
| Entry Date | Expiry | # Contracts | Price | Strike | Delta | Theta | Vega | Gamma |
| October 2nd | November 20th | +10 | 2.39 | 20 | -0.40183 | -0.02676 | 0.02914 | 0.05705 |
| October 2nd | November 20th | -10 | 1.45 | 18 | -0.28497 | -0.02349 | 0.02557 | 0.05007 |
Net Debit
$940
Selling the position the day after
| Entry Date | Expiry | # Contracts | Price | Strike | Delta | Theta | Vega | Gamma |
| October 3rd | November 20th | +10 | 3.01 | 20 | -0.49118 | -0.02590 | 0.02763 | 0.06398 |
| October 3rd | November 20th | -10 | 1.89 | 18 | -0.36507 | -0.02441 | 0.02604 | 0.06030 |
Realized PnL
$180
Selling the position two days after
| Entry Date | Expiry | # Contracts | Price | Strike | Delta | Theta | Vega | Gamma |
| October 4th | November 20th | +10 | 4.16 | 20 | -0.63373 | -0.02198 | 0.02296 | 0.06854 |
| October 4th | November 20th | -10 | 2.78 | 18 | -0.50619 | -0.02330 | 0.02433 | 0.07265 |
Realized PnL
$440
Selling the position October 15th
| Entry Date | Expiry | # Contracts | Price | Strike | Delta | Theta | Vega | Gamma |
| October 15th | November 20th | +10 | 6.67 | 20 | -0.89421 | -0.00969 | 0.00775 | 0.04791 |
| October 15th | November 20th | -10 | 4.85 | 18 | -0.80962 | -0.01440 | 0.01152 | 0.07121 |
Realized PnL
$880
Trading the VIX 18/14 Bear Put Spread
A much riskier, but also far more rewarding spread is the 18/15 Bear Put Spread. This spread is also a debit spread which means it does not require margin. Purchasing 10 of these requires $1120 USD.
| Entry Date | Expiry | # Contracts | Price | Strike | Delta | Theta | Vega | Gamma |
| October 2nd | November 20th | +10 | 1.45 | 18 | -0.28497 | -0.02349 | 0.02557 | 0.05007 |
| October 2nd | November 20th | -10 | 0.33 | 14 | -0.09172 | -0.01139 | 0.01241 | 0.02429 |
Net Debit
$1120
Selling the position the day after
| Entry Date | Expiry | # Contracts | Price | Strike | Delta | Theta | Vega | Gamma |
| October 3rd | November 20th | +10 | 1.89 | 18 | -0.36507 | -0.02441 | 0.02604 | 0.06030 |
| October 3rd | November 20th | -10 | 0.48 | 14 | -0.13244 | -0.01391 | 0.01484 | 0.03437 |
Realized PnL
$290
Selling the position two days after
| Entry Date | Expiry | # Contracts | Price | Strike | Delta | Theta | Vega | Gamma |
| October 4th | November 20th | +10 | 2.78 | 18 | -0.50619 | -0.02330 | 0.02433 | 0.07265 |
| October 4th | November 20th | -10 | 0.83 | 14 | -0.22283 | -0.01742 | 0.01820 | 0.05433 |
Realized PnL
$830
Selling the position October 15th
| Entry Date | Expiry | # Contracts | Price | Strike | Delta | Theta | Vega | Gamma |
| October 15th | November 20th | +10 | 4.85 | 18 | -0.80962 | -0.01440 | 0.01152 | 0.07121 |
| October 15th | November 20th | -10 | 1.81 | 14 | -0.49495 | -0.02114 | 0.01691 | 0.10454 |
Realized PnL
$1920
Trading such a spread means you are hedging on heavy directional delta, vega and gamma. This is a great spread to trade when you have a lot of conviction of the future movement of VIX and know it's going to just drop like a rock.
Trading the SPY 290/300 Bull Call Spread
Probably the riskiest, but clearly the most rewarding trade would be the SPY 290/300 Bull Call Spread. This requires a lot of conviction in the direction of the market itself and not simply volatility. Purchasing 10 of these requires $3250 USD.
| Entry Date | Expiry | # Contracts | Price | Strike | Delta | Theta | Vega | Gamma |
| October 2nd | November 20th | +10 | 5.41 | 290 | 0.46230 | -0.06416 | 0.41918 | 0.02509 |
| October 2nd | November 20th | -10 | 2.16 | 300 | 0.23839 | -0.05004 | 0.32690 | 0.01956 |
Net Debit
$3250
Selling the position the day after
| Entry Date | Expiry | # Contracts | Price | Strike | Delta | Theta | Vega | Gamma |
| October 3rd | November 20th | +10 | 6.51 | 290 | 0.52145 | -0.06555 | 0.41955 | 0.02522 |
| October 3rd | November 20th | -10 | 2.72 | 300 | 0.28453 | -0.05582 | 0.35727 | 0.02147 |
Realized PnL
$540
Selling the position two days after
| Entry Date | Expiry | # Contracts | Price | Strike | Delta | Theta | Vega | Gamma |
| October 4th | November 20th | +10 | 8.69 | 290 | 0.61925 | -0.06421 | 0.40241 | 0.02405 |
| October 4th | November 20th | -10 | 3.95 | 300 | 0.37209 | -0.06376 | 0.39953 | 0.02387 |
Realized PnL
$1490
Selling the position October 15th
| Entry Date | Expiry | # Contracts | Price | Strike | Delta | Theta | Vega | Gamma |
| October 15th | November 20th | +10 | 11.07 | 290 | 0.74659 | -0.06259 | 0.30042 | 0.02273 |
| October 15th | November 20th | -10 | 5.08 | 300 | 0.47773 | -0.07789 | 0.37388 | 0.02829 |
Realized PnL
$2740
Keep in mind that holding this bull call spread to expiry would result in a total of $6750 USD total profit. In general, this type of spread is much riskier as denominating the movement of the market for longer period based on volatility only is difficult.
Fixed IV Rank
Please keep in mind that the example spreads created use a fixed IV Rank to determine the price of each strike. In the real world, IV Rank changes drastically day to day even for big indices such as the S&P 500. With good understanding of IV. A good rule of thumb is to buy when IV is low and sell when IV is high. This rule doesn't mean you should avoid a great trading setup when you do see one though.
VIX versus VIXW
VIXW bid and ask spreads are much wider in comparison to the normal VIX options chain. If you are hedging on a specific delta short or long. We highly suggest trading VIX, unless you're able to get a price near the bid. However, if you are trading delta neutral such as a credit spread. If possible, try to trade a VIXW spread. Try to avoid getting an order fill near the bid, and if it's not possible to get a fill near the ask. Just trade a VIX credit spread instead.
Conclusion
This pattern should be simple, easy and effective to follow. There are actually more complex ways to effectively trade this strategy. And, even potential triggers for shorting SPX, NDX based on VIX options movement. However, effectively trading those types of strategies requires a solid understanding of how the Black Scholes Model works, and how deviation in options pricing from Black Scholes impacts the price of the S&P and Nasdaq. In another article, we will be going over Open Interest and how cumulative Gamma on Open Interest can impact the direction of the market to move it up or down.